Why is the Supply of Housing So Low?
The current supply of housing for sale is at one of the lowest points in recent history. Some estimates put it in a 1-2 month range instead of a typical 6 months.
In prior posts, we’ve discussed the record high prices of lumber due to shortages having an effect to delay new homes. However, there have been other spikes in prices which have driven the total price of new homes ever higher. Aluminum and other materials reflect cyclical highs while other materials peaked recently before retreating. This may be no surprise to those who follow the rapid increase in inflation since the new administration arrived in January. In practically every case in history, large increases in inflation follow large increases in federal spending. And the current federal spending binge continues to blaze new records every month, boding more inflation. Note the start of larger increases around July of 2020 with 2021 reflecting an accelerating and larger price spike in building materials.


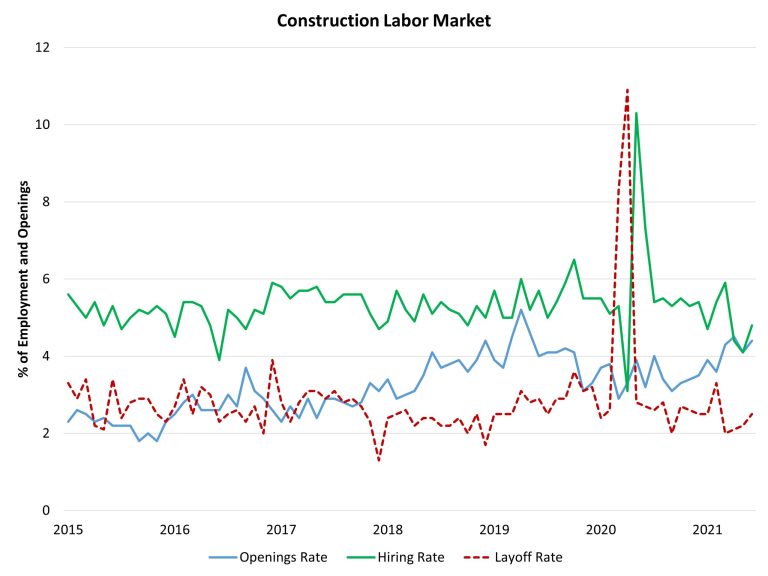
Forbearance has allowed more than 2 million homeowners to still own homes after more than a year of non-payment. The record low rates also allowed more than 11 million to refinance to lower rates. The combination of these has reduced what would be a normal season of home sales and moves. Borrowers occupying homes longer. Fewer homes under construction, but each one costing more. Building also has been constrained by a shortage in labor.
Housing Construction Volume
Demand for housing was red hot in the spring but cooled in late summer and early fall. May’s housing starts number came in surprisingly weak. The month of April recorded a decline of 9.5% from the prior month. But a bigger bottleneck exists. A lack of land ready for housing construction has hurt building and reflects an overlooked issue. The boom in home prices and home purchases depleted the number of available ready to build lots. Zonda, a housing analysis firm, demonstrated the lack of ready to build lots in the following chart.

The scale represents a relative level of supply with 85+ reflecting appropriate supply. 75 to 85 represents slightly undersupplied and below 75 reflects significantly undersupplied. So the current level under 50 reflects an extreme lack of supply.
It takes time to convert land to ready to build lots. The time may be as little as 6-12 months in some states. Other states such as California push the permitting and planning process to an extreme of 2-10 years or more.
Labor Bottleneck
Like many industries, labor for home building may have had individuals change roles during the pandemic. Zonda also tracks this information. For 2021, construction employment increases lag new home sales significantly.

