Rebuilding the 2008 Financial Crisis
During the week of February 21, eight federal agencies joined together to tell lenders to reach out to lend to poor credit risks. They didn’t actually use those words, but the directions were clear. The last time we saw this was the run up to 2008. Will the letter convince lenders to lend to bad credit risks? After 2008, lenders incurred more than $500 billion in losses, penalties and compliance costs. According to some reports, banks are currently spending an extra $50 billion per year to comply with post 2008 laws and regulations. Why are regulators rebuilding the 2008 financial crisis?
The letter is encouraging lenders to ignore all that for a political agenda. In addition, regulators aren’t going to approve ahead of time the ability of lenders to deviate from the regulations in order to lend to poor risk borrowers. So, the regulators encourage lenders to violate lending regulations which the regulators put in place and enforce. Which will likely lead to rating downgrades, losses, penalties, and other fines from these same regulators for not following the regulations. Only in politics and government would that make sense. Read Winning Mortgage, Winning Home and this blog to see all the bricks from 2008 that have already been put in place in 2022.
University of Michigan Consumer Sentiment Survey
The University of Michigan compiles a survey of consumer sentiment every month. In two of the last three months, the index has been below 60. The last time this happened was 2008 crisis. Before that, except for a brief flash drop in 2011 flash crash, only the recessions of 1974-75 (oil embargo and inflation – WIN slogan) and 1979-1981 (17%-20% interest rates to fight raging inflation) showed similar readings. In fact, the current inflation is the worst since that 1979-1981 period. With continued reckless policies, the Federal Reserve and Biden Administration seem hellbent on creating the next major recession and market meltdown.

In the 3rd quarter of 2021 the survey on consumer sentiment first plunged to its lowest level in a decade. In fact, the drop was extreme on a monthly basis. Only two times in the last 50 years has the drop of any similar magnitude from one month to the next occurred. One drop coincided with the start of popping the housing bubble in 2007-2009 and the other the initial Covid pandemic in April 2020. Note also the correspondence of drops in consumer sentiment and recession. 1973-1975, 1979-1981, 1990-1991, 2007-2009 and the start of pandemic in 2020. Read more about our concerns about the current excessive inflation, its causes, and potential effects on housing and mortgages.
Don’t Call It Subprime. Call It Targeted Lending
So how will regulators try to put this is play. They will be looking for FNMA and Freddie Mac to implement the lending policies. In a replay of 2008 though FNMA and FHLMC forced the lenders to buy back billions and billions of loans for things almost as mundane as putting a comma in the wrong place (a defect). Since the federal government controls FNMA and FHLMC with your tax dollars, we are likely to see this new program go into effect. Just don’t call it subprime this time. Call it targeted lending.
Fannie Mae has recently hinted that they might soon take action on that front. Enough said. Another brick in the wall of rebuilding the 2008 financial crisis.
Cashing Out – The Home Equity Piggy Bank
Leading up to the 2008 financial crisis, home owners had been using home equity as a piggy bank. Many of these borrowers were then unable to pay mortgage payments after 2008. They had been pulling equity out and increasing payment requirements to fund overspending in their monthly budget.
In a revival of pre-crisis actions, lenders originated $1.2 trillion in cash-out refis in 2021, up 20% compared to the prior year, the highest volume since 2005. Cash-out refis went from 36% to more than 60% of all refis from the beginning of 2021 to the fourth quarter.
In 2021, homeowners tapped $275 billion in equity. In the fourth quarter, more than 1 million homeowners tapped $80 billion.
Housing Affordability (or non-Affordability)
Statistics out the week of April 3 show that housing affordability is on track to mirror the run up to the 2008 crisis. That is, affordability sucks–it’s not getting better. Not including real estate taxes and insurance, payment requirements are now well above the peak before the 2008 crash. And at present, insurance and property taxes are well above those 15 years ago also.

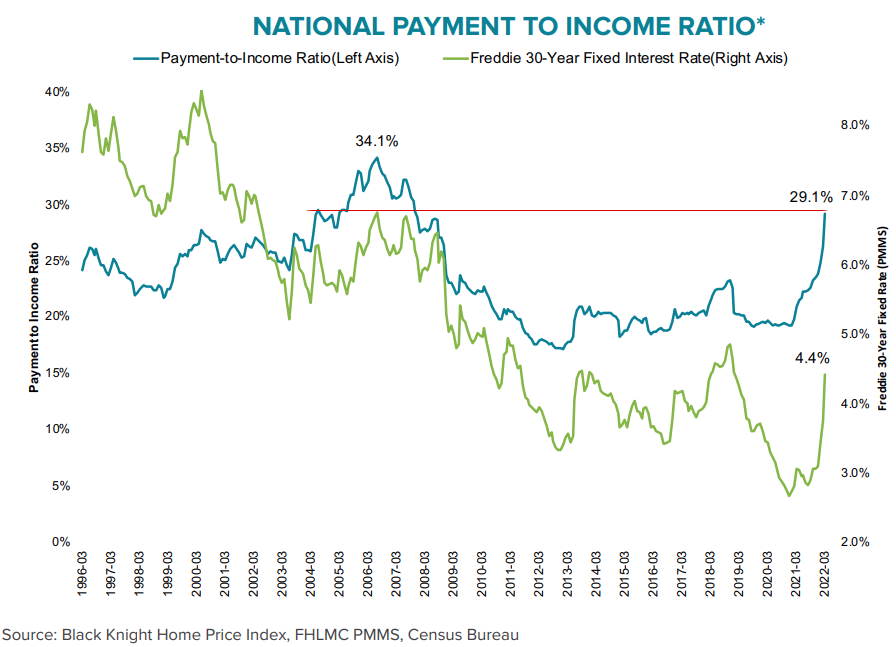
As the chart suggests, this ratio was only ever higher for a few years leading up to the mortgage meltdown and financial crisis of 2008.