2022 Cost of Living Adjustment
UPDATED. Each month and each year, the Bureau of Labor Statistics tracks and publishes inflation data. This data then creates the annual Cost of Living Adjustment for Social Security recipients and Social Security taxes on workers. COLA (Cost of Living Adjustment) represents increases in Social Security payments to retirees as well as adjustments to other items. For workers, the actual Social Security tax rate of 6.20% will not go up. The contribution ceiling will increase from !142,900 to $151,225. If you earn less than $142,800 you will see no change. If you earn more than $142,800, your Social security taxes will go up as much as $522 next year. Since your employer matches that, the true cost to you will be $522 plus $522 in raises you won’t receive since it will go to taxes on the employer.
But if you receive Social Security, your paycheck will go up. If you receive Social Security payments of $2500 per month, a 5.9% raise is an additional $125 per month in your pocket.
On October 13, the CPI-W for September came in with .4% month over month increase. The overall inflation for the last 12 months came in at 5.9% depending on the BLS statistic used. And the Social Security Administration has announced a 5.9% increase. Unfortunately, inflation for October and November have pushed annual rate of inflation to 6.8% and it is now trending at 7.6% to 8.4% going into 2022. So everyone is losing – time to ask for a 10% to 15% raise or change jobs?
Current Inflation Rate
Inflation comes in many numbers depending on what it measures. For the COLA and other calculations, the 5.9% increase is an official measure for government programs. But general inflation ran at an 8.00% annual rate for the three months ending July 2021 for example, down from a rate of 9.2% as of June 2021. So 5.9% may be understating the effect on your wallet.
Still, the increase was the largest increase in 40 years. That means inflation is running the highest it has run in 40 years! Dilbert says it best:

Or perhaps it was Jimmy Carter/Joe Biden who said it best:
Inflation Transitory?
Members of the Federal Reserve argue the spike in inflation is transitory. What does that mean? Do they expect a decrease in prices to roll back the increases felt by consumers? No, they mean the rate of inflation will subside. The actual price increase remains! If something cost $1 a year ago and $1.10 today, 10% inflation occurred. The Fed doesn’t say the price returns to $1. It says the rate of increase falls from 10% back to its target of around 2% a year. So, it stays at $1.10, then $1.12 next year. The inflation which already occurred wasn’t really transitory–it remained permanently.
That inflation number may cause panic if it remains elevated. Jamie Dimon noted that if inflation remains so high that it causes the central bank to “jam on the brakes, pull out liquidity, then you’re going to see a huge reaction.” That would cause not a slow rise in interest rates sought by the Federal Reserve, but instead a quick, severe spike upwards in rates. That would occur at the time all realize the forecast for inflation was wrong.


November 2021 Update
On a trending basis, overall inflation at the consumer level based on the trailing 3 months’ average jumped to an annual run rate of 7.2%. The six month average presents a more consistent trend, staying above 7.0% for the entire period and recently rising to an annual run rate of 7.6%. As a consumer, you more likely identify with this larger increase than the year over year change noted by BLS. The BLS number is seasonally adjusted–consumers are seeing a spike in food prices on a real basis, not an adjusted basis.
The producer price measurement (inflation at the business level prior to passing on cost increases to consumers) continues to run higher. The most recent 3 months annualized run rate of 7.2% compares to a 9.2% rate for the trailing 6 months annualized. Year over year though, the rate remains high, at 8.6%. Pick any of these numbers. The consistency of such high inflation rates at the producer level indicates upcoming increases in prices to consumers. Quite possible those increases will well exceed what the CPI report has recently shown.
The Steadiness of the 6 month trailing run rate above 7% for CPI and above 9% for PPI indicate that prices at the consumer level likely won’t slow the increase in 2021. The recently passed “infrastructure” bill contains only about 20% of the more than $1 trillion actually earmarked for infrastructure. The rest will trickle into inflation over the next 5 years. Expect high inflation to remain past 2025.

Core PCE Inflation as Used by the Federal Reserve Inflation Targeting
On Friday, October 29, the most recent measure of the PCE was released. The Core PCE rose to 3.6% and all PCE rose to 4.4%, both 30 year highs.
As mentioned in the update above, the measure of Personal Consumption Expenditures (PCE) is used by the Federal Reserve as the inflation measure of choice. By law, the Federal Reserve must rein in inflation as one of its two core missions (the other is targeting full employment). And inflation using PCE just had its biggest spike ever in 2021.
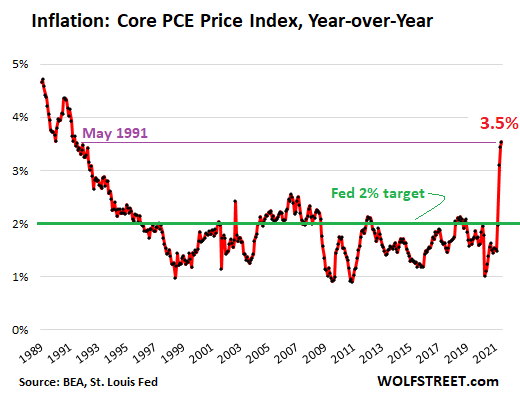
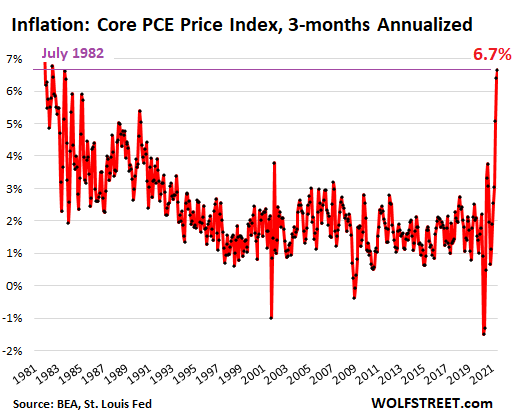
In the chart above, the year over year (annualized) rate is shown. But that doesn’t tell the whole story. One needs to break down the trend in more detail to see whether inflation is or is not “transitory” as quoted by the Fed. This next chart shows the trend using the most recent three months annualized. By examining this measure, the most recent information and trend appears more clearly. Again, the recent spike dwarfs anything on record. Inflation on this measure (next chart) reflects a run rate of 6.7%, in line with other measures. And the Fed uses this measure since it “lowballs” inflation by all other measures tracked by the federal government. Inflation now has reached levels not seen in 30 years according to this measure, 40 years in other measures. Forty years ago, the Fed killed the stock market after driving interest rates to more than 17%.
Growing Inflation Trend Continues to Surprise and Confound the Federal Reserve
Inflation has surprised the Fed on the high side this year. About every three months, the Federal Reserve Open Market Committee (FOMC) meets. A release of “Projection Materials” follows which shows what FOMC members think of the economy and inflation. The median projection for core PCE inflation after each meeting lagged behind reality with the gap now dramatically greater. Housing and rent inflation have yet to make it into these numbers and likely will increase the spike further. Again, the spike likely stems almost exclusively from over-spending and over-stimulus from the federal government coupled with Federal Reserve artificially keeping rates low to support the borrowing of the federal government. Other factors have only a limited influence (Covid, supply chain, etc).
- December – core PCE projection for 2021: 1.8% (actual =1.5%)
- March – core PCE projection for 2021: 2.0% (actual = 2.0% and surging on a monthly basis)
- June – core PCE projection for 2021: 2.1% (actual 3.5% and surging on a monthly basis)
Effect of Inflation on Housing and Interest Rates
Many times, inflation may have an effect to push up real estate prices. We have already seen that happen to home prices over the last year from an inflated supply of money. The effect of free money from the Federal Reserve has been a significant contributor to inflation. Massive spending by the federal government is the second pillar causing high inflation. There are some supply chain and production issues from Covid, so not 100% of inflation is attributable to the federal government. But those supply chain and production issues will work themselves out. A proposed additional massive spend by the federal government is in the works. If passed, look for inflation to pass 10%, but not likely in the third quarter.
Will this be the trigger to double, triple or quadruple interest rates? We will need to wait and see. Will this be the trigger to cause a 20% to 30% drop in housing prices like 2008? We will need to wait and see. Coupled with other 2008 like housing decisions from the federal government, a housing implosion in late 2022 to 2023 isn’t out of the question. Don’t get caught stretching your budget to buy a house in the present market! Prepare by reading Winning Mortgage, Winning Home.
The Rental Component of Inflation
One of the important inputs to calculate inflation comes from the “Owner Equivalent Rent.” This represent an estimation of the rent/payment for housing, but for those who own their home. Think of it as the cost if you rented the home you own. Increases in housing prices feed one part of this statistical measurement. It takes more monthly rent to pay for a more expensive house. Rent for rental properties also plays a role in inflation. Combined, these represent the “shelter” component of inflation. The following chart below compares the Zillow Rent Index with the Consumer Price Index rent component. Shelter is two-fifths of the total index, so the question of whether inflation is “transitory” or not depends on rents.
The shelter component of the US Consumer Price Index reflects an increase of just 2% a year. Private gauges measure inflation in shelter at nearly FIVE times that rate, or 10%. It takes the Bureau of Labor Statistics about a year to catch up with rent inflation. The inflation you see in the BLS statistic happened perhaps a year ago, not now. Remember, leases generally run 1-2 years, so many have not yet renewed it the current market. What does this tell you about where the shelter component of the CPI is headed? UP and up for a period of time in the CPI.

The Advantageous Purchase Window
Back in March, we made a prediction about a possible opportunity to buy and borrow arriving in late 2021 and early 2022. At that time, housing prices jumped monthly and buyers lined up to buy homes sight unseen. Many homes sold for 20%, 30% or even 100% over ask price. Materials prices for lumber had quadrupled and builders began slowing sales and construction in order to re-price homes for the increased materials costs. Lumber alone looked to add $25,000 to $40,000 to the price of a home. In the face of all that bad news for buyers, we predicted that the market may turn in the buyers direction before long.
By August, the price of lumber has fallen back to its approximate level prior to the pandemic and materials panic. But, it’s not quite back down to average price levels for the past decade. And recent inflation numbers recently spooked it back higher to some extent. Builder schedules have begun reverting back. Interest rates have fallen for mortgages by a quarter point to a half point. Fannie Mae and Freddie Mac have eliminated the half point adverse market fee being charged on a refinance. The Housing Index compiled by the National Association of Home Builders (NAHB) fell 6% in August. So far, the cumulative housing outlook has fallen more than 13% since the beginning of the year! This means the potential for patient buyers to buy attractively has been increasing in 2021 and at an increasing rate.
But What About Inflation and Federal Spending?
In March, inflation had not shown the acceleration now rearing in the market. At that time, the federal government had overspent. It had not yet gone on the additional spending binges now in the works. Those will likely have a severe impact on housing prices. But an impact how?
The likely outcome may duplicate prior cycles. In prior bouts of inflation resulting from similar bad government policy, housing prices took a quick, severe hit. The hit ranged from 15% to more than 25%. That opened up a buying window for a 1-3 year period before inflation drove housing prices higher. Owning for a long term became a good strategy. But only if the buyer had money in reserve to weather any adverse setback such as a job loss for a period of time. The key was to avoid over-borrowing your budget and having cash in the bank. We expect home prices to flatten or move slightly down towards the end of the year and early 2022. Not a big move, but a return to stabilization and balance in the market.
Interest Rates
The outlook for interest rates is mixed. At present, the Federal Reserve is committed to holding interest rates low. If this continues into 2022, an opportune time to borrow may continue. We expect this to be the case. The Federal Reserve is usually well behind the market and slow to react to inflation or deflation and is prone to over-react. The Fed has committed to holding rates low into 2022 and believes inflation to be transitory. Meaning they expect inflation to not increase or remain elevated for a period of time. That time period has been indicated as 2-3 years. So the Fed will be slow to recognize that inflation isn’t transitory.
Once more federal spending kicks in, look for inflation to continue to accelerate into later 2022 and 2023. By that time, mortgage rates will have crept up to nearer 4.00% from the current 2.75% to 3.00%. If inflation moves up more than expected and remains there, look for mortgage interest rates back in the 5.00 to 6.00% range by 2023. Higher inflation would push these rates even higher. In order to slow or stop inflation, actions by the Fed could lead to that 15% to 25% drop in home prices. The current home price is propped up by the low, low rates.
What Now?
Normally, inflation pushes up real estate prices. Borrowing at the cheapest rates without a bidding war for a home presents an opportunity to consider in late 2021 and early 2022. As of August, bidding wars have fallen dramatically. A direction may be more visible in the next few months. While there may be a drop in prices later in 2022 and into 2023, it may only last 2-4 years. Those who have not read Winning Mortgage, Winning Home and planned accordingly may fall prey to an adverse market and outcome in multiple ways.
Stay tuned and add Dilbert.com to your daily viewing.
